
We have had one of the worst economic shocks the world has seen in recent history because of the Covid-19 global pandemic. Big money is made in stocks when one invests when the macro-economy is down and the markets are also wobbly.
We definitely have one of the above conditions satisfied. As to whether we are in a bull-market or a bear market, I would just say that these are definitely not the best of times for the stock market.
These are the times when we want to find good opportunities and invest to potentially make multi-bagger returns.
In this series, I will try to look at past known multi-baggers with the benefit of hindsight and try to take out learnings which will help us spot multi-bagger opportunities in the future.
Why did we get interested in this stock (CCL Products)?
Let us assume we are sitting sometime around Sep-12. It is just 3 years since the global financial crisis in 2009 and the world seems to have half-managed to come out of the recession. However, not everything is good. Inflation is high in India, growth is not very encouraging. The world has printed a lot of money and every day there is news of PIGS – Portugal, Italy, Greece, Spain which may go bankrupt from the massive debts raised by their governments during the global financial crisis. The Euro is under severe threat and many experts are predicting the breaking up of the European Union.
We are stock investors and we want to find some good stocks to invest in. So, we search and we search hard.
We come across a company which has grown its sales and profits by more than 35% in the last one year.

In a world starved for growth, this company seems to be doing some sort of a miracle!
And to top it up, it is trading at a measly PE ratio of 8.
Market-Cap (stock price Rs 26 in Sep-12) = Rs 335 Cr.
We have never heard about this company and don’t know what it does.
We want to investigate further. Where should we start researching?
Before spending any time trying to find out what this company does, we will first check the financials of this company.

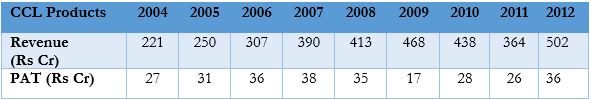
The company has grown sales at a moderate rate of 11% CAGR between 2004 and 2012. Operating margins are decent and there are no wild fluctuations in the operating margins. The company has reported profits every year and was also profitable in the disaster year of 2009.
Now, let us check the cash flow from operations

CCL Products has a positive cash flow from operating activities in all the last 9 years, even during the global financial crisis which is a good performance.
Cum PAT ~ cum CFO and there is not much variation between the two figures over the last 9 years. This is a quick check for accounting frauds.
We like companies which are consistent performers. We do not want to buy businesses whose fortunes change a lot with business cycles because I have no special talent in predicting business cycles.
However, profit after tax (PAT) has only grown from Rs 27 Cr in 2004 to Rs 36 Cr in 2012. This is a growth of 4% CAGR, frankly quite mediocre.
But, let us investigate a little more.

A few observations from the above data
- Receivables days has remained more or less constant at a moderately high figure of around 60-70 days. The company has shown steady performance through the global financial crisis
- However, inventory days have shown a deteriorating trend.
- Net Fixed Assets have increased by 9 times in these 8 years.
The company has expanded aggressively. This is very interesting. - But revenues increased by only 2.3 times between 2004 and 2012 (in 8 years).
This is quite significant and we need to investigate more.
Before we open the annual reports and invest significantly more time analyzing the company, we will do a little more number crunching.
The company significantly increased its capacity in 2006 and again 2008. Did it find difficult to sell this added capacity?
Did the pressure to sell added capacity result in margin reduction or a substantial increase in receivable days?
A quick look at the above table tells us that the operating margin in fact increased between 2005 and 2006 and when CCL Products increased capacity again in 2008, its receivables days reduced from 75 to 59 days though the margin shrunk a little from 14% to 12%.
This shows that the company has not had too much difficulty in selling from its enhanced production capacity. This is an encouraging sign.
One final check before we decide whether we are still interested in this company and want to investigate more.

We observe that the company has not raised additional equity capital over the last 9 years. The company has funded the massive capex done either through internal accruals (company profits) or through raising external debt. The debt to equity ratio has jumped whenever new capex was done, but it has always been manageable and has not gone out of control.
To summarize our findings till now
- Sales and PAT have grown by 35%+ in the last one year
- CCL Products is trading at a cheap valuation – price to earnings ratio = 8
- Company has made profits in all the last 9 years
- Cash Flow from operations is positive in all the last 9 years
- Operating performance of the company is steady, in fact margins have increased from 11% in 2004 to about 18% in 2012.
- Receivables days are more or less constant at 60-70 days.
- There is no equity dilution in the last 9 years.
- The company has increased fixed assets by a whopping 9 times in the last 9 years
- But sales have increased by only 2.3 times
- PAT has increased by only 1.3 times from Rs 27 Cr in 2004 to Rs 36 Cr in 2012
Points 1 to 8 above are encouraging, however point 9 and 10 are actually disappointing.
Most investors would probably just drop pursuing this idea from here. In all probability, if I had encountered CCL Products in Sep-2012, considering points 9 & 10 above, I would have probably looked for other better ideas which have the potential to grow fast and show substantial increase in profits and sales.
However, I am curious at this stage as to why inspite of points 1 to 8 being in favour of the company, it has not been able to show a good performance in revenue and PAT growth?
If for some reason (curiosity seems to be the only explanation for me), one decided to look at the financials carefully again, he would realize that operating profits have increased from Rs 24 Cr in 2004 to Rs 87 Cr in 2012 which is an increase of a respectable 3.6 times compared to a PAT increase of just 1.3 times.
Why has this happened?
And the answer is straight-forward. The PAT is lesser because of interest on loans and depreciation which gets deducted from the operating profits. Since CCL Products increased fixed assets by 9 times, it has also increased its debt by 9 times from Rs 28 Cr in 2004 to Rs 268 Cr in 2012. This would have resulted in significantly higher interest costs and depreciation charges.

The significant increase in interest paid and depreciation explains why PAT has increased by a measly 1.3 times even though revenue and operating profits have increased by a significantly bigger multiple.
Now it is time to open the company website and the annual reports to find out more about the business operations of the company.
What does CCL Products do?
Green coffee beans that grow on coffee plantations need to go through a conversion process to get converted into usable form of coffee. Coffee can be majorly divided into two forms – the traditional roast and ground coffee and instant coffee. The difference between the two is that while preparing coffee at home/restaurant, the traditional grounded coffee needs to go through a process called “brewing” which takes anywhere between 10 to 20 mins whereas instant coffee can be prepared within a few mins by just adding hot water/milk and/or sugar.
Think of it like the difference between “freshly brewed” beer Vs the canned beer.
CCL Products is one of the largest manufacturers of instant coffee.
Industry Background
Coffee is the 2nd most popular beverage in the world after water.
The largest producer of Coffee in the world is Brazil (40%) followed by Vietnam (20%). India produces about 5% of the world coffee production.
Japan is the largest consumer of coffee, followed by countries like Russia, Italy, Germany, Eastern Europe, US, etc.
Every country’s consumer has their own preference for drinking either traditional roast/ground coffee or instant coffee. On aggregate it is estimated that about 33% of the world coffee consumption is that of instant coffee. Coffee drinkers have their own taste preferences and choices – very similar to the alcohol market. This means the blends and varieties of coffee consumed are enormous.
Coffee manufacturing is a highly competitive industry with relatively low barriers of entry.
The company itself agrees that there is over-capacity of suppliers of instant coffee.
Extract from the 2012 annual report.

Reading further, we come across this statement from the 2010 annual report.

The company claims that they have designed a business model which results in more or less stable operating margins. We do not take this statement at face value and want to verify it.

What we observe from the above data is that inspite of the intense competition, CCL Products has been able to maintain more or less steady operating margins. So, there seems to be some merit to the management claim that their business model is designed for stable margins inspite of wildly fluctuating prices of the raw material – i.e., green coffee beans.
Going through the management discussion and analysis of year 2012 tells us that the company has recently expanded capacity at its Andhra Pradesh plant.

We also observe that the company is setting up a new plant in Vietnam which will start commercial production by Dec-2012.

From the past, we have observed that whenever the company has gone for capacity expansion, it has been able to ramp up production and utilize its increased capacities. We can easily infer from the fact that the company is again expanding capacity after a gap of 4 years since 2008 that the company is optimistic about future volume growth.
Why is CCL Products expanding capacity in Vietnam? (and not in India)
A little bit of reading on the internet and we realize that Vietnam is the 2nd largest cultivator (20% of global cultivation) of coffee beans. What is more interesting is that Vietnam grows a type of coffee called Robusta coffee beans. Instant Coffee is majorly manufactured using Robusta Coffee beans which are cheaper than the Arabica coffee beans which are cultivated in Brazil – the largest cultivator of coffee (40% share).
Robusta coffee beans are cheaper than Arabica coffee beans by around 10% and thus Vietnam has a natural cost advantage when it comes to making instant coffee. Also, Vietnam is part of ASEAN and enjoys duty-free access to several markets and thus it is probably cheaper to make and export coffee from Vietnam to European and other countries than exporting it from India.
Now, let us ask ourselves the question – what is the moat/competitive advantage of the company?
We do not have any special knowledge of the coffee industry. But we know this –
- Coffee manufacturing is a very competitive industry with a lot of fragmented unorganized players.
- We guess that Coffee Chains and brands like Starbucks, Nestle, etc. make good profits because they have the power of their brands which CCL Products does not have.
- Though CCL is able to maintain stable operating margins, it does not seem to have the power to substantially increase prices.
- What CCL is able to add is economies of scale and also ability to manufacture different varieties of coffee. This is especially helpful for supermarkets and other bulk private label sellers of coffee who want to procure at scale from a reliable manufacturer.
There is one more thing we must investigate before we decide to proceed further.
Why in the last 9 years inspite of expanding fixed assets by 9 times, the sales have only increased by 2.3 times?
Many times, companies show fake capital expenditure and siphon off money. The way they do it is that the contract to execute the capacity expansion is given to an associate company at inflated prices. Usually this associate company is owned by the promoters but not by the public minority shareholders.
This is a risk to the minority shareholders.
A quick glance at the revenue and PAT numbers tells us that though revenues dropped by 15% from Rs 438 Cr in 2010 to Rs 364 Cr in 2011, the PAT was almost the same. Why has the revenue dropped?
Is it because coffee bean prices have reduced or is it something else?
When we go through the 2011 annual report, we may get some clue of what happened

It seems CCL Products disinvested one of its subsidiary companies in 2011 and that is the reason why the consolidated revenue would have decreased. We observe from the 2010 annual report that Associated Coffee did a turnover of ₤ 41 Mn which is approx. Rs 287 Cr and a PAT of only ₤ 0.18 Mn which is approx. Rs 1.3 Cr.

If we check the related party transactions in the 2010 annual report, CCL Products has only sold goods worth only Rs 96 Cr to Associated Coffee Merchants (UK) even through ACMIL has made a revenue of Rs 287 Cr.
What does Associated Coffee Merchants (UK) ie ACMIL do? This company is basically a coffee trading company based out of United Kingdom. Going through the older annual reports, we come across this from the 2003 annual report

Let us check the financial performance of Associated Coffee Merchants (UK) separately

Clearly, Associated Coffee Merchants (UK) is a small trading firm which pretty much struggles to make even small profits. However, its turnover is large and it seems this company has helped CCL Products gain international experience and help it sell the coffee it produces in the international markets.
If we now check the standalone financials of CCL Products during this period

Between 2004 and 2012, fixed assets increased by 9 times and revenue increased by 6.5 times i.e., at a rate of 23% CAGR.
As an additional check, let us track what was the actual quantity of coffee manufactured by the standalone Indian entity

Data for installed capacity is not so easily available, but the company has given actual production data in its annual reports.
Clearly, we see that CCL Products has substantially grown its production volumes (in MT) in the last 9 years. Sales (Rs Cr) have grown by 23% CAGR in the last 9 years and production has grown by 14% CAGR in the same period.
So, we are satisfied. The discrepancy between increase in net fixed assets and increase in revenue was due to the consolidation of the coffee trading firm Associated Coffee Merchants (UK) which was divested in the year 2011. The Indian standalone entity has grown its production capacity aggressively and also its sales volumes which has driven the revenue growth.
Now, let us try and estimate (not predict) of how the future may pan out for this company.
Let us try and imagine what 2018 could look like for this company
- Can the company double its revenues?
i.e., a CAGR of 12% over the next 6 years?
Production increase (9 year) = 14% CAGR
Sales increase (9 year) = 23% CAGR
The company is planning capacity expansion in Vietnam (5000 MT) which will soon start production. 12% CAGR over 6 years would probably mean increasing the capacity to about 30,000 MT. This should result in doubling of revenues.
My opinion – This should be possible - Can the company maintain/improve its operating margins?
My opinion – Should not be difficult to maintain margins. The company is starting production capacity in Vietnam which enjoys raw material advantage as well as being a part of ASEAN, has free trade agreements with major coffee consuming nations. - Pay off the debt from cash flow from operations and significantly reduce its debt to equity ratio from the current value of 1.1?
Market-Cap (2012) = 360 Cr
Total Debt (2012) = Rs 268 Cr
The company now makes about Rs 80 Cr operating cashflow. This means it will generate about Rs 450 Cr of operating cashflow in 6 years.
Any additional Capex and working capital (inventory + receivables) requirements should be fulfilled through operating cashflow without the need to raise more debt.
My estimate is that total debt will remain at similar levels or reduce a bit though I will be surprised if debt substantially increases.
(Of course, if company expands faster, they may raise more debt which will be manageable since the revenues and operating profits will proportionately increase) - Can operating leverage kick?
Production Capacity (2013 Est) = 20,000 Tons
Actual Production (2012) = 12,392 Tons
We can easily estimate that CCL Products is operating at about 70% capacity and over the next 6 years, the production capacity should increase to about 30,000 MT. This would mean, the revenues double. It should now be possible to spread the interest charge and the depreciation over a wider base and operating leverage will kick-in.
E.g. If revenues double, the operating profits may increase by 3 times. - What PE ratio could this company trade at?
300 years of stock market history suggests that bull markets are followed by bear markets and bear market are followed by bull markets.
2012 was a bear market which is certain to be followed by the bull market. The only problem is nobody knows when and how the next bull market will come.
When the next bull market comes, what PE ratio should CCL Products trade at?
This is definitely not a Gillette or a 3M India. It cannot trade at a PE ratio of 50 or 60. But, we can reasonably assume that when better days come (bull markets) a decent well-run business like CCL Products can easily trade at a PE ratio of 15-16.
One thing is certain, since the company will probably maintain / improve its performance even if PE expansion does not happen, we do not expect the PE ratio to reduce.
Our guess about the future of this company (standing in 2012)

Based on the simplistic estimation mentioned in the above table, we expect the stock price of CCL Products to increase by a multiple of (Operating Leverage X PE expansion + Capital Structure Deleveraging) = 3 x 2 + 0 = 6 times
This would mean a massive 35% CAGR returns over the next 6 years.
What actually happened between 2012 and 2018?
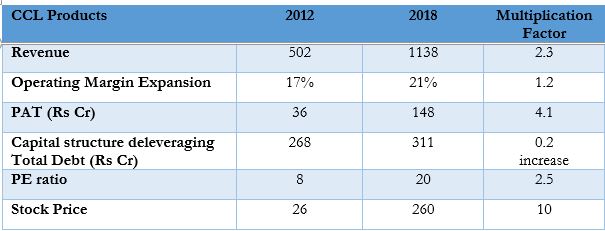
The stock multiplied by (Operating Leverage X PE expansion X Operating Margin Expansion + Capital Structure Deleveraging) = (4.1*2.5* – 0.2) = 10
The stock delivered a return of a whopping 47% over the next 6 years

To summarize our reverse engineered formula for a multi-bagger stock
- Look for a business with steady/consistent performance across business cycles.
- The business should be profitable and ideally have positive cashflow even in bad years.
- Prefer businesses that will not require external equity capital and thus will not dilute existing investors.
- The business is available at cheap valuations
- The business can grow moderately fast in the future (say 12 to 15% CAGR)
- There is a scope for operating leverage and a higher increase in PAT compared to the increase in revenues
- There is a possibility of PE expansion and thus we make good returns just by PE expansion
I have made it sound so easy to spot a multi-bagger in the above article. So why did people miss this wonderful opportunity? Because most people
“Focus on everything other than what is important and crucial for the investment thesis to work out.”
- The stock of CCL Products had given negative returns in the 7 years prior to Sep-This is inspite of the fact that the revenue had doubled even though the PAT had remained more or less the same.
Learning – Do not make judgments purely based on the historical price movements. Read and understand what the reported numbers and business model of the company are telling us.

- During the global financial crisis, the stock had fallen to a low of Rs 7 in Mar-09 which is a loss of 80% for someone who had invested in this stock in Sep-05 at a price of Rs 40
There is no chance that an investor would have held on to this stock and remain invested during this time unless he had forgotten that he holds this stock or had physical shares certificates which he was now unable to locate.
Learning – It is not enough to just identify a potential multi-bagger. We need the patience, knowledge/conviction and the courage to hold it. We need deep study and understanding of business metrics to recognize whether our investment thesis is on track or we need to re-evaluate and maybe sell the business and buy something else. - After declaring good results in 2012, the stock had already run-up by 100% from its Jan-12 price of about Rs 13. With bad news about the Indian and global economy making newspaper headlines every day, it was difficult to buy this small-cap stock which had already doubled in 8 months.
Learning – Microeconomics always trumps macro-economics. Also, do not let the near-term price movements cloud your judgment about the business and its potential. - Let us tell ourselves the truth. This is a contract coffee manufacturer. Its not such a great business. It is a decent business, but definitely not a quality business like Gillette, Colgate, HUL, Asian Paints, HDFC Bank etc. Any investor would have tried to search for better businesses to invest in.
Learning – It is not necessary to invest only in the best businesses without considering other factors like growth, valuations etc. We need to identify a good business, available at cheap valuations which can grow at least moderately without requiring external capital and which has the potential for both margin expansion (operating leverage) and PE expansion
Now a natural question will come to your mind. Is this company worth investing today?
For an answer to that question, you may consider availing my investment advisory services.
If you are interested, please fill-up this form and I will get in touch with you within the next 2 days.
Disclaimer:
Do not consider this article as a recommendation to buy or sell a stock.
Please seek advice from your investment advisor before making any investment decisions.
The author (@amey_candor) is a SEBI registered Investment Advisor.

13 Responses
Interesting analysis, I entered around the same time with pretty much similar analysis. They had citi PE I think and their exit is what brought this stock to my radar….started accumulation at 15-17 Rs and ended at about 45 rs avg cost since it took me a while to complete the analysis….. S
I am a noob. I didn’t understand your strategy here. what does `started accumulation at 15-17 Rs and ended at about 45 rs avg cost ` mean. Could you please elucidate? Ty.
Since CCL Products increased fixed assets by 9 times, it has also increased its debt by 9 times from Rs 28 Cr in 2004 to Rs 268 Cr in 2012. This would have resulted in significantly higher interest costs and depreciation charges.
The only confusing part is that, if the debt has gone up fr 28 Cr to 268 Cr, How the Debt/Equity ratio rose only to 1.1 from 0.5, without any increase in Equity ?
The rest of the analysis is fantastic, especially, when the market is agog with experts who advises to invest only in few specific names to get a multibagger.
Thanks
Total Equity = Share Capital + Retained Earnings
The reason debt to equity ratio has not increased so much is because they have not increased additional share capital, but have made good profits ie increased retained earnings
This explains the moderate increase in debt to equity from 0.5 to 1.1
Equity also includes reserves and surplus
Hi Amey,
Really liked the way you traced the evolution of a multibagger. May I know where could I find the annual reports prior to 2010? I’m able to find the ARs from 2010 and above only through platforms like screener.
Appreciate your help!
https://www.reportjunction.com/
All past annual reports available on this website
It seems reports available on reportjunction.com comes at a hefty price for a retail investor. Is there any free source for annual reports available on internet?
[…] How to spot a multi-bagger? […]
Excellent 👌 analysis. Expecting more like this.
Perfect article. I would like to thank for this amazing blog and also recommend every investor and trader
One needs to keep a very long term and promoter oriented vision if they want to be successfully invest for multi-baggers. Spotting them is one thing, being invested in them before they do become one is another thing.
Instead of relying too much on picking multi baggers, the focus should be on diligent investing. I think that will help create real wealth.