


I came across this quote and it got me thinking – as a stock market investor, how can I make use of the economic slowdown we are witnessing in India right now?
The sector that is generally affected the most in an economic slowdown is the auto sector. And hence newspapers have been full of slowdown news about this sector for the last few months.
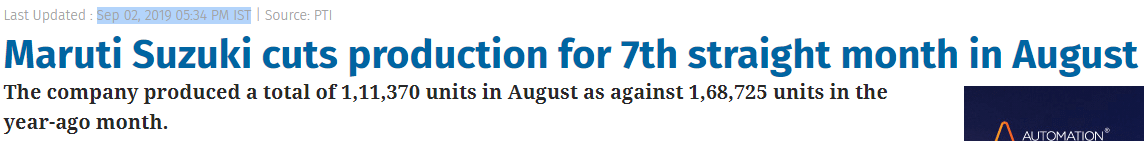

Maruti Suzuki – the largest passenger car manufacturer in India with more than 50% market share is facing a prolonged crisis with 7th straight month of production cuts.
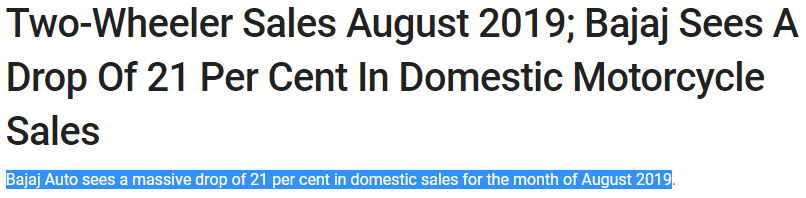

Bajaj Auto which was able to somehow tide over the slump in sales over the last several months in the two-wheeler sales because more than 40% of its bikes are exported has also seen a 20% reduction in domestic sales.


Reduction in sales volumes at one of the most respected business houses and automobile companies in India – Tata Motors is a brutal 58%!!
So, in this gloom and doom – where is the silver lining?
Automobile Industry is a cyclical industry – this is a globally observed phenomenon. This is especially true of the medium and heavy commercial vehicle segment.
The medium & heavy commercial vehicle industry in India is dominated by two players with around 90% market share – Tata Motors and Ashok Leyland. This is true for the last several years and thus it is very easy to analyse this space.
As an investor, we want to solve simple problems; there is no extra money to solve complex problems.
Let us look at what happened to the M&HCV sales numbers of Tata Motors and Ashok Leyland the last time we had a slowdown in the Indian economy – in 2008-09 and 2013-14.


M&HCV sales fell by 30% in 2009 and then immediately recovered the next year to reach higher volumes in the subsequent two years.
Sales volumes fell for two continuous years in 2013 & 2014 and then slowly recovered over the next few years.
Let us look at data from Ashok Leyland


We observe a similar phenomenon for the sales data of Ashok Leyland. Sales of M&HCV fell in the recession year of 2009 to recover back in the last two years.
Sales again fell for two years in 2013 & 2014 to recover in the next few years.
- When will the current economic slowdown end?
- When will the sales of medium & heavy commercial vehicles pick-up again?
We don’t have answers to these questions. But, we have answers to the following questions
- Will India recover from the economic slowdown at some point?
- Will sales of commercial vehicles increase again sometime in the future?
The answer is a clear YES – history tell us this. Inspite of Asian currency crisis in 1997, tech bubble bursting in 2001, global financial crisis in 2009, European debt problem and taper tantrum in 2013, China debt bubble in 2016, Indian economy has grown rapidly at an average pace of 6%+ over the last 30 years. Though the current problems we are facing like US-China trade war, bank NPA troubles, consumption slowdown are unique to these times, India has always come out of economic problems and done better. In fact, at this point we are in a better overall situation – inflation is at historical lows, current account deficits are under control, crude oil prices are low and don’t seem to be increasing in the near future, Indian forex reserves are abundant, political stability is the best in several decades.
Let us now look at how the stock price of Ashok Leyland behaved during the previous economic slowdowns.


Ashok Leyland || Stock Price Chart 2008 to 2012
The stock price went up from a low of Rs 7 in Dec-08 to Rs 39 in Nov-10 in just 24 months giving a return of 550% to the investor.
A similar trend played out in the economic slowdown of 2013-14

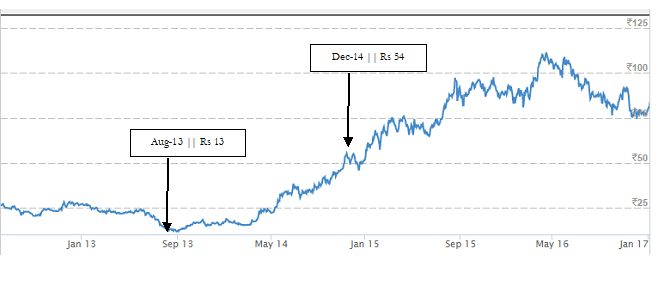
Ashok Leyland || Stock Price chart 2013 to 2016
The stock price went up from a low of Rs 13 in Aug-13 to a high of Rs 106 in Apr-16 in just 32 months giving a return of 815 % to the investor.
If the opportunity was so obvious, why haven’t I heard a lot of people making money in this stock?
There is a simple reason – we ask the wrong questions
- Will the stock price fall more after I buy it?
- Will the sales fall further?
- Exactly when will the economic recovery happen?
- Will it take 12, 24 or 36 months or more for a full recovery?
- Can I time my purchase to exactly coincide with the absolute bottom?
These questions have no precise answers.
Let us look at the last question in particular – can I catch the bottom?
If we check the monthly sales data of Ashok Leyland
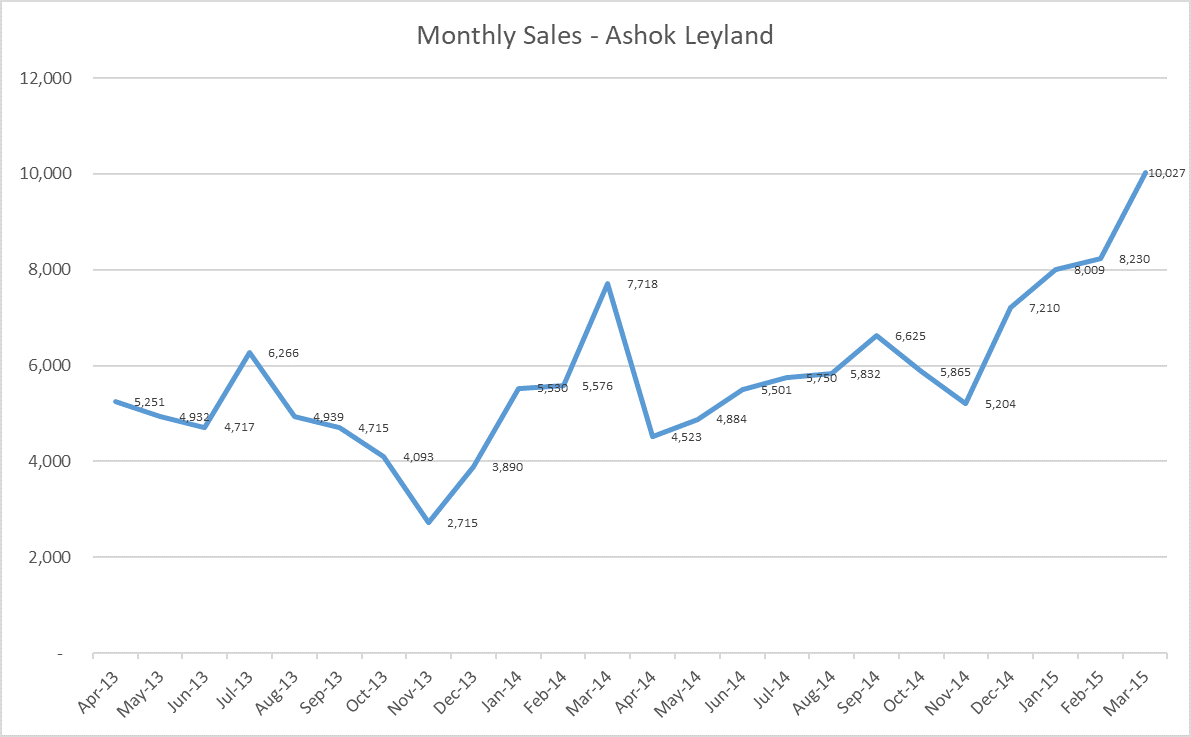

The monthly sales bottomed out in the month of Nov-13 at 2,715 units and was not on a sure-shot recovery path before Dec-14 when monthly sales crossed 7,000 units.
However, if we look at the stock price again,


The stock price bottomed out in Aug-13 itself a good 4 months before sales numbers started improving and by Dec-14 when it was apparent that the recovery was well under-way, the stock price had already climbed to Rs 54 giving a return of 400%.
Thus, the stock price movement was well in advance of the actual sales data. The stock market was able to predict what is happening and priced the stock accordingly.
Now we have to answer some obvious questions
- Why not buy Tata Motors?
Tata Motors is a far more diversified business – it has a passenger vehicle division in India, owns Jaguar and Land Rover brands with global sales. Thus, recovery in medium & heavy commercial vehicle sales may/may not immediately/directly reflect in its stock price. Also, Tata Motors has a lot of debt and is facing global challenges on multiple fronts including disruption by electric vehicles. - Why not buy two wheelers – Bajaj Auto or Hero Motocorp?
India is already the largest two-wheeler market in the world with an annual sale of approximately 2.5 Cr two wheelers. This is a huge market and there is a small chance that the current slowdown can partly be explained by structural reasons – like market saturation. Also, if it takes more time for the economic recovery, the improvement in sales may not be as dramatic as is generally observed in M&HCV. - Why not buy into Maruti Suzuki?
The logic is similar to not buying into Bajaj Auto and Hero Motocorp. Analysts tend to look at India as a separate 2-wheeler and 4-wheeler market and hence believe that the Indian 4-wheeler market is under-penetrated as compared to US, China or other developing countries like Malaysia, South Korea, Brazil etc. However, my view is that we need to look at India as a combined 2 & 4-wheeler market. Such a view means that automobile penetration in India is already moderately high and there is a small chance that due to structural reasons, passenger vehicle sales may remain subdued for more time in the future.
You make this investment sound so obvious and simple, why won’t the mutual funds do it?
Investment is not just stock analysis, it is as much temperament and conviction. The reason mutual funds will not make this investment at least in a meaningful way is because of what is called as institutional imperative. Imagine the work-day of a fund manager at a large mutual fund and the conversations he has with his superiors and peers
- They do the analysis on the auto sector and a star analyst from the team comes up with the idea of investing in a company like Ashok Leyland.
- Here are some of the questions the fund manager asks the star analyst
When will the economy slowdown stop?
When will the reduction in sales stop?
When will the sales of M&HCV vehicles increase?
How much will the sales of M&HCV vehicles increase?
- Why are all these questions important for the fund manager?
Mutual Funds get paid not for returns they provide, but how much money they manage.
In the above investment, success is certain but the timing is highly uncertain. If the mutual fund buys into Ashok Leyland and the stock falls 40% more in the next 6 months, the investors of the mutual fund start pulling out money. The mutual fund falls out of favour with the “mutual fund advisors” and they stop recommending the mutual fund to their clients.
The mutual fund which earns a fixed percentage of the total sum of money it manages (AUM) will see a reduction in its income and profits.
- Should the fund manager take such a risk on his own salary income to help you earn more money in the stock market?
- What is worse – the bosses will fire the fund manager and hire someone else.
Will the fund manager take a personal career risk just so that you make some more money?
- Have you observed that the fund manager at most mutual funds changes every 2-3 years; either they get fired or get promoted to a different role?
Why are individual investors like you and me in a position to make this successful investment?
Since we are convinced with the investment thesis, and we have done our own research, we will have the conviction and the patience for the investment thesis to work out. We have more time in our hand to let the investment idea work itself. We will not doubt the idea every 3 months. The questions that are important to us are not when will the recovery happen but whether the recovery will happen. There is extreme uncertainty over the question “when” but high degree of certainty around the question of “whether” the recovery in the economy and M&HCV sales will happen.
Thus, individual investors like you and me are at a huge advantage compared to fund managers to execute such an investment idea.
But what if the economic slowdown persists for 12 more months and the stock price of Ashok Leyland falls further by 30, 40 or 50% more?
There is a simple solution for this problem – space out your purchase. Buy shares of Ashok Leyland of a fixed amount every month for the next 24 months. If the share price continues to fall, you will get the share cheaper and you will also not feel the fear when one sees red in one’s portfolio. You will look forward to buying the stock every month because you will get it cheaper.
But, is this time different?
This time is indeed different – the current slowdown in sales can partly be explained by 2019 specific reasons like
- Upward revision in axle load norms.
You may read about this decision here.
It is postulated that the freight-capacity has increased due to this government decision. However, since these norms were already below global standards in India and were not revised since the 1980s, there was rampant overloading. Thus, the actual impact on capacity utilization of revision in axle load norms is not very clear.
- Abolition of Octroi with the implementation of GST.
GST implementation has significantly reduced the travel time. Time wasted at Octroi clearances has vanished and this has resulted in approx. 20% efficiency gains.
You may read more about this in this news coverage by Hindu Business Line
- Migration to stricter pollution norms – Bharat Stage VI from Mar-20.
Stage VI technology is expected to increase the cost of the commercial vehicle by about 10%-15% which can become a big dampener on purchase of new vehicles in the next 1-2 years.
However, there will always be specific/unique issues behind every slowdown. These issues will sort themselves out and over a period of time demand will pick-up as the past data suggests.
Now, let us come to the most important piece in the puzzle – what price to buy the stock at?
We will change this question a little – what is the maximum price I should pay for this stock?
Since we won’t be able to catch the absolute bottom, we will stagger our purchases and restrict our purchase price to a certain upper ceiling.
Let us look at what are the historical lows that the stock has seen. For this, we use a metric that is popularly used for cyclical businesses – Enterprise Value (EV)/sales.
Enterprise Value = market-cap + debt.
For cyclical industries like automobiles, the metric EV/sales is a very good indicator of the relative cheapness of the company. Since, in a falling demand scenario, sales fall and profits fall even faster traditional metrics like PE ratio become very tricky.
Let us calculate the highest and the lowest value this EV/sales ratio reached for Ashok Leyland in the past 12 years.
Let us look at the lows hit by the stock in Dec 2008
| Stock Price (Dec-08) | Rs 6.58 |
| Market Cap (Rs Cr) | 2000 Cr |
| Debt (Rs Cr) | 1958 Cr |
| Enterprise Value | 3958 Cr |
| Sales (Rs Cr) | Rs 7935 Cr |
| EV/Sales | 0.5 |
Let us now look at the bottom of Aug-13
| Stock Price (Aug-13) | Rs 12.51 |
| Market Cap (Rs Cr) | 3,672 Cr |
| Debt (Rs Cr) | 4,355 Cr |
| Enterprise Value | 8,362 Cr |
| Sales (Rs Cr) | Rs 12481 Cr |
| EV/Sales | 0.64 |
What were the peaks achieved by this stock?
Let us look at data from Nov 2010
| Stock Price (Nov-10) | Rs 39.42 |
| Market Cap (Rs Cr) | 11,572 Cr |
| Debt (Rs Cr) | 2,280 Cr |
| Enterprise Value | 14,140 Cr |
| Sales (Rs Cr) | Rs 7,407 Cr |
| EV/Sales | 1.91 |
And data from the peak April 2016
| Stock Price (Apr-16) | Rs 110.48 |
| Market Cap (Rs Cr) | 32,432 Cr |
| Debt (Rs Cr) | 2,415 Cr |
| Enterprise Value | 34,577 Cr |
| Sales (Rs Cr) | 18,937 Cr |
| EV/Sales | 1.84 |
Now, let us look at this vital metric as of today in Sep-19
| Stock Price (Sep-19) | Rs 62.6 |
| Market Cap (Rs Cr) | 18,377 Cr |
| Debt (Rs Cr)* | 632 Cr* |
| Enterprise Value | 19,005 Cr |
| Sales (Rs Cr) | 29,055 Cr |
| EV/Sales | 0.65 |
*Note – Standalone debt is considered to calculate Enterprise Value (EV) since most of the consolidated debt is attributed to Hinduja Leyland Finance Ltd. – the vehicle finance subsidiary (61% holding) of Ashok Leyland.
We observe from the above exhaustive analysis that the valuation of Ashok Leyland is at historic lows with EV/sales metric at just 0.65. It was only in the global financial crisis that it went lower.
This is a good time to start buying Ashok Leyland.
One can keep buying till the time EV/sales metric is below 0.9 ie the stock price is below a level of approximately Rs 85 and then wait for EV/sales to increase above 1.5 to consider selling the stock ie above a stock price of approx. Rs 145 per share.
There are a couple of differences this time as compared to previous economic slowdowns that we need to be mindful about.
- Ashok Leyland has far less debt this time than in previous economic slowdowns – this makes the business far more robust and increases its ability to tide over the slowdown. However, it also means that when economic recovery comes, the returns may not be as phenomenal as in the past. This is because when times improve, sales improve and the company would pay down the debt. This would result in a far bigger increase in market-cap as the value of the reduced debt is captured with the increase in market-cap.
We still expect to make handsome returns this time.
- Ashok Leyland has a vehicle financing subsidiary (Hinduja Leyland Finance Ltd) which was started in 2009 and was a much smaller entity in the 2013-14 downturn. Any turmoil in this subsidiary like higher NPAs may play spoil sport. However, the gross NPA as of Mar-18 was around 3.5% which seems manageable. The gross NPA for the largest vehicle finance company – Shriram Transport Finance is around 8.5%
We have purposefully not analyzed a few aspects of the business-like product portfolio, financial ratios, competition, market share, future product pipeline etc. These aspects can be read in any of the research reports of the company or a credit rating report.
What will prevent you from making money in this investment idea – it will be your own behavior and not the behavior of the economy, company, government, interest rates etc.
If you are convinced about the investment thesis – execute it well and don’t stop your regular monthly purchases. Over a few years, the investment will generate more than handsome returns.
Disclaimer:
Please don’t interpret this article as a stock recommendation but an illustration of the kind of analysis that goes into fundamental research and equity investing.
The author (@amey153) is a SEBI registered Investment Advisor.
If you want to seek investment advice click here and someone from my team will get in touch with you within 48 hours