


What is the business of CARE Ratings?
CARE Ratings is one of the several credit rating agencies registered with SEBI and RBI. It provides credit rating services to any company that wants to avail loans from banks or through issue of debt securities.
The following are the major credit rating agencies registered with the regulator
CRISIL
CARE Ratings
ICRA
India Ratings
Brickworks Ratings
Credit Rating agencies are market infrastructure entities.
Banks rely on the credit rating assigned to decide whether to sanction/disburse the loan. Retail and institutional buyers of debt securities also rely on the rating assigned to particular debt securities.
Thus, they are tightly regulated by the Securities & Exchange Board of India (SEBI).
The credit rating market is an oligopolistic market with the top 5 rating agencies making the bulk of the market. Their relative sizes are mentioned below
| Revenues (Rs Cr) | 2019 | Market-Share |
| CRISIL | 545 | 42% |
| CARE Ratings | 301 | 23% |
| ICRA | 234 | 18% |
| India Ratings | 143 | 11% |
| Brickwork ratings | 79 | 6% |
| Total | 1302 | 100% |
CRISIL is by far the largest and the most respected/relied credit rating agency amongst all the credit rating agencies. CARE Ratings is a clear leader in terms of revenue amongst all the rest.
CARE Ratings Financials
| CARE Ratings (Rs Cr) | 2012 | 2013 | 2014 | 2015 | 2016 | 2017 | 2018 | 2019 |
| Operating Revenue | 180 | 203 | 236 | 261 | 265 | 278 | 323 | 301 |
| PAT | 108 | 114 | 129 | 138 | 120 | 148 | 162 | 137 |
| Cash/Equivalents | 270 | 381 | 459 | 335 | 381 | 466 | 518 | 439 |
| Return on Equity | 29% | 28% | 28% | 33% | 31% | 32% | 29% | 25% |
| Dividends | 29 | 57 | 81 | 229 | 82 | 82 | 162 | 88 |
From the above table we clearly observe that CARE Ratings is a highly profitably business. The company generates healthy profits and cash flow. CARE Ratings has also been paying healthy dividends every year since it got listed on the stock exchanges in 2012.
CARE Ratings Valuations
Stock Price (06.01.2020) = Rs 597
Market – Cap = Rs 1,760 Cr
Cash & Equivalents = Rs 425 Cr
Total Debt = 0
Enterprise Value = market-cap – cash = Rs 1,345 Cr
PAT (12 months trailing) in Sep-19 = Rs 117 Cr
PE Ratio = 11.5
For a profitable, zero debt company like CARE Ratings which is operating in an oligopolistic market, a PE ratio of 11.5 seems quite low.
Its peer credit rating agencies are currently trading at much higher valuations CRISIL’s PE ratio is 36 and ICRA’s PE ratio is 32
What is the problem?
Sales Growth (3 Yrs) = 4.5%
Sales Growth (5 Yrs) = 6.3%
Is low sales growth the only problem or is there something else?
The quasi-government infrastructure behemoth blew up in Sep-2018


This was a surprise for most market players as just a few days before this default, the bonds of IL&FS were AAA rated. The role of the credit rating agencies came under doubt.


SEBI started an investigation in Dec-18 into impropriety on the part of the credit rating agencies that rated the IL&FS debt.
In fact, by Jul-19 SEBI forced two of the credit rating agencies ICRA and CARE Ratings to send their respective Managing Directors on leave pending the investigation.


The enquiry by SEBI has now been completed and the SEBI order has found serious lapses on the part of CARE Ratings while issuing credit ratings to IL&FS


The SEBI probe found that CARE Ratings while issuing the rating to the instruments of IL&FS failed to do proper Due Diligence
On the insistence of SEBI, when the enquiry was pending, both CARE Ratings and ICRA asked their respective MD&CEO to go on leave in Jul-19.
A few months later, ICRA removed its MD&CEO – Mr. Naresh Thakkar in Aug-19 and the MD&CEO of CARE Ratings – Mar. Rajesh Mokashi has resigned from services in Dec-19.
The entire IL&FS episode has severely hit the reputation of CARE Ratings and the credibility of its “credit rating process” and the “quality of ratings” has been severely dented.
On the back of this, CARE Ratings’ revenues have declined substantially in Q1FY20 & Q2FY20
YoY decline (Q1FY20) = -19%
YoY decline (Q2FY20) = -28%
What is the cause of this severe revenue decline?


The number of bank instruments rated by CARE Ratings in the first half of FY20 is down a massive 40% from the corresponding figure in the first half year of FY19.
This is massive and seems to be beyond the normal ups and downs which are a part of running a business. The CARE Ratings management claims that due to economic slowdown and the NBFC Crisis, the overall bank credit growth has decreased and this is an industry-wide problem.
Is this true?
According to this news article

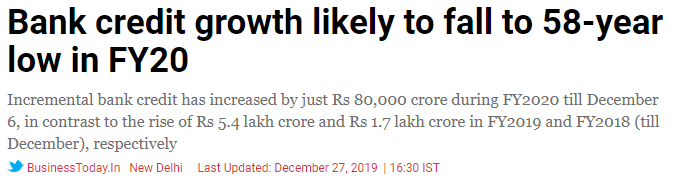


The bank credit growth has definitely seen a severe deceleration. The incremental bank credit growth has only been around Rs 80,000 Cr in the first nine months of FY20 compared to around Rs 5.4 Lac Cr in the corresponding period of FY19.


The street also fears that after the IL&FS debacle, banks and other institutions may have stopped putting their trust in quality of credit rating given out by CARE Ratings.
Let us check if the revenue decline is an industry-wide problem, has revenue decreased for the other credit rating agencies as well?
| YoY revenue growth | Q1FY20 | Q2FY20 |
| CRISIL | 2% | 16% |
| ICRA | (-9%) | (-7%) |
Revenues of CRISIL have actually increased in Q1FY20 & Q2FY20. There does seem to be a trend that banks and financial institutions have probably started relying more on CRISIL which has an impeccable track-record. However, the revenues of ICRA have moderately decreased, though the decline is lesser than that seen for CARE Ratings.
Does this mean significant loss of market share for CARE Ratings?
The management denies this and says that their market share has remained robust.


However, CARE seems to be measuring the market-share in terms of number of customers as is evidenced from this answer by Mr T Arun Kumar


Data on number of instruments rated and the total amount of debt rated is not shared on a quarterly basis by CRISIL and ICRA and thus we do not have a fool-proof method to confirm if the fall in revenues for CARE Ratings is a loss of market-share or a major portion of it can also be attributed to the macro-economic environment and the decline in bank credit growth.
In fact, the CARE Ratings management claims that it is premature to conclude from the quarterly revenue numbers of the credit rating agencies that only CARE Rating has seen decline in business.


T Arun Kumar mentions that the revenue recognition policies of the three credit rating agencies are different and this could explain the significant difference in the quarterly revenue numbers of the three listed credit rating agencies – CRISIL, CARE and ICRA.
The revenues of a credit rating agency can be divided into two parts
- Initial Rating Fee
- Surveillance Fee
Fee for monitoring the rating during the next 1 year / tenure of the loan/bond
ICRA Revenue Recognition Policy


The surveillance is free for 1 year from the date of the initial rating. Separate surveillance fees are charged only after the second year. Thus, the management divides the rating fees received between initial rating fees and surveillance fees (1st year) based on their own judgment.
CRISIL Revenue Recognition Policy


CRISIL also seems to be following a similar approach when it comes to revenue recognition. It uses its own judgment to divide the rating fee received between initial rating fees and surveillance fees over the next 12 months.
CARE Rating Revenue Recognition Policy


It seems CARE Rating chooses to recognize most of the rating fees upfront, when the rating is issued to the borrower. Only a small portion of the fee received is recognized as surveillance fee over the next 12 months.
Does this difference in the revenue recognition policy have a bearing on the historical quarterly numbers of the three credit rating agencies?


Note: Only Ratings Segment revenues are considered
The quarterly revenues for CRISIL are pretty smooth. One of the reasons for this could also be that CRISIL also does a lot of outsourcing work for S&P Global.

The quarterly revenue of ICRA is also relatively smooth over several quarters. The revenues have shown a stagnation/decline from Q3FY19 quarter


The quarterly revenue of CARE ratings fluctuates a lot across quarters.
The historically fluctuating revenues of CARE Ratings suggests that the lower bank credit growth and the reluctance of banks to lend to NBFCs has probably had a higher impact on the revenues of CARE Ratings than that of ICRA and CRISIL.
So, the CARE management assertion that the decline in revenues is not due to a significant decrease in market share does seem to hold water.
We will have to observe the revenue pattern of ICRA and CRISIL over the next 3/4 quarters to get more data to confirm this hypothesis since it will be more than a year since a slowing economy and reduction in bank credit growth.
It is widely believed that CARE Ratings and ICRA were at fault in the whole IL&FS rating fiasco and their CEOs also had to pay a heavy price for their alleged involvement/oversights during the entire episode.
When the adjudication proceedings were started by SEBI in Dec-18 against ICRA, CARE, India Ratings and Brickworks it was anticipated that if and when SEBI finds that these credit rating agencies were at fault, there could either be a severe fine or in the worst-case scenario, their credit rating license could be revoked.
However, the maximum fine permitted under the SEBI Act 1993 is Rs 1 Cr. And when the SEBI order came in Dec-19, it found the credit rating agencies failing in their duty to conduct proper due-diligence and imposed a fine of a paltry Rs 25 Lac. CARE Ratings has liquid investments worth Rs 425 Cr. This meagre fine will hardly make any dent in its balance sheet
Another fear was that there could be litigation by the financial institutions who relied on the ratings issued by CARE and invested in the bonds/NCDs of IL&FS. These institutions may claim damages and penalties in a court of law and this could be a severe financial hit to CARE and other rating agencies.
However, let us look at the definition of what is a credit rating
What is a credit rating?
The SEBI (credit rating agencies) Regulations 1999 very explicitly lay it out.

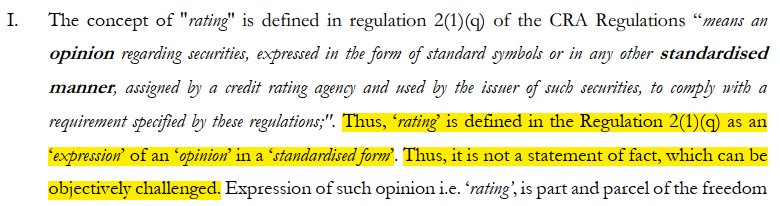
Credit Rating is an “expression of opinion”
In fact, regulation 18 of the said regulations clearly states that credit rating is neither an investment guarantee nor a recommendation to buy/hold/sell a particular security.


All those market participants/financial institutions who choose to rely on the credit rating to make their investment decisions must keep it in mind, the “credit rating” is just an opinion. They are not prohibited in finding out more details and conduct further due diligence.
Thus, the market participants who suffered losses because they “relied” on credit rating and then later suffered losses cannot blame credit rating agencies and cannot claim “damages” in a court of law. Only SEBI has this prerogative to conduct investigation/adjudication proceedings on credit rating agencies.
SEBI has found CARE ratings along-with India Ratings and ICRA guilty of lapses in the rating procedure and has already fined these credit rating agencies (Rs 25 Lac each).
There doesn’t seem to be any other financial liability on the part of CARE Ratings for its wrongdoings in the whole IL&FS fiasco.
All this is fine; however, the credit rating market is pretty saturated as can be seen from the historical growth rates in the rating segment revenues
CRISIL (7-yr sales growth) = 5%
ICRA (7-yr sales growth) = 8%
CARE (7-yr sales growth) = 8%
For us to make money in CARE Ratings, not only do the revenues have to start increasing from the currently witnessed reduction, the PE ratio will also have to inch up towards its historical average.
Again, let us turn to history
Do the PE ratios of the credit rating agencies rhyme?


Just before the global financial crisis, CRISIL was trading at a PE ratio of 46 in 2008. The PE ratio fell to 16 in the depths of the financial crisis and increased to 35 by Jan-2014. Then the PE ratio touched a high of 63 in Jan-15 to now come down to 36 in Jan-20


Just before the global financial crisis, ICRA was trading at a PE ratio of 52 in 2008. The PE ratio fell to 14 in the depths of the financial crisis and stayed around 18 till Jan 2014. Then the PE ratio touched a high of 70 in Jan-15 to now come down to 31 in Jan-20


CARE Ratings also seems to have followed a similar rhyming pattern. CARE got listed in 2012. The PE ratio of CARE Ratings went down to 14 in Aug-13 which then rose to 43 in Apr-15. The PE ratio stayed high and again made a high of 45 in Apr-17, and today with the decline in revenues, the PE ratio is down to 15.
What may happen to the PE ratios of the credit rating agencies 3 years down the line, when the economy will be in a better shape and credit growth will be much faster than what it is today? Unless CARE ratings stops to exist, in all probability, the PE ratio CARE Ratings will be higher than 30.
Now, let us look at similar episodes in the past and see what we can learn from them.
Let us look at what transpired when the credit rating agencies were caught red-handed in the Global Financial crisis
The dubious role of the credit rating agencies in the global financial crisis of 2008 has been discussed quite extensively. It has also been made famous in popular culture by the movie “The Big Short”. Watch the short youtube clip from the movie to check how the credit rating agencies worked during the global financial crisis

What happened after the bubble broke?


S&P ratings revenues declined by a massive 26% in 2008 and did not recover till 2 years later in 2010. And the revenues from ratings segment in the year ending Dec- 2018 increased to $2.9 Bn


Moody’s rating agency also suffered a revenue decline of a massive (-23%) in 2008 and had not recovered till 2010. And the total ratings revenues in the year ending Dec-2018 increased to $2.7 Bn
In fact, the US government agencies probing the role of the credit rating agencies in the global financial crisis forced them to pay hefty fines.


S&P paid a massive $1.5 Bn fine


Moody’s settled the case by paying a fine of $834 Mn
But what happened to their stock price after the lows it reached in 2009?


After falling from a high of $70 per share in Jun-2007, the stock prices fell to $18 in Feb-2009 a massive 75% correction.
Today SPGI is trading at $294, a cool 1522% returns in 11 years – a CAGR of 29% a fantastic return for the developed world over a 10-year period.
Let us look at what happened to the Moody’s stock price


After falling from a high of $67 per share in Jun-2007, the stock prices fell to $18 in Feb-2009 a massive 72% correction. Today Moody’s is trading at $249, a cool 1383% returns in 11 years – a CAGR of 27% a fantastic return over a 10-year period
How does the current valuation of CARE stack-up?
- Sales (2018) = Rs 323 Cr
- Assuming a 20% decline in revenue, FY20 revenue will be approx. Rs 260 Cr
- The expenses are almost fixed in nature as the major cost item is the employee cost. Thus, extrapolating the last 2 quarter expenses to the full year,
- Expenses (FY20) = Rs 160 Cr (Est)
- Actual expenses FY19 = Rs 144 Cr
- Operating profit = Rs 100 Cr
- Let us ignore the Rs 35 Cr odd revenue from its existing liquid investment of Rs 425 Cr
- PAT (FY20) = Rs 75 Cr (Est)
Thus, CARE Rating is trading at a PE ratio of 1345/75 = 18
Check the enterprise value (Rs 1345 Cr) calculations at the start of the article.
So, factoring in a severe decline in revenue (-20%) and given the current times of very poor credit growth and economic slowdown, this debt-free, cash-rich, high return on equity company operating in an oligopolistic market is available at a forward PE ratio of 18.
This seems to be a bargain.
From all the analysis we have done above, how is the future likely to play out?
- The trend of declining revenues could easily continue for another year for CARE Ratings.
- Today, the Indian economy is in a recession, but sometime in the future (2/3 years later) reversion to mean may happen and we will start growing at 6% to 7% which has been the average growth in the last 30 years since economic liberalization in 1991.
- NBFC crisis will reduce/get solved, lending to NBFCs will resume and reach historical levels
- Bank credit growth will again revert to mean from the severe decline we have seen in the first 9 months of FY20.
- PE ratio of CARE Ratings may inch upwards and we can expect it to trade at a PE ratio of 30 when the economy is growing at 6%+ and the bank credit growth has again stabilized.
- Let us picture a scenario in 2024. Profits of CARE Rating will be back to what it made in 2018 before the Indian economy started decelerating
ie PAT (FY24) = Rs 162 Cr
PE Ratio (in FY24) = 30
Market-Cap (FY24) = Rs 4,860 Cr
Estimated Returns in 4 years = 29% CAGR
Risks
- In the IL&FS fiasco, CARE Ratings has suffered a reputational blow. Market share may permanently shift to its competitors – CRISIL, ICRA, India Ratings, Brickworks. However, this probability seems remote as all the other credit rating agencies except CRISIL are equally tainted.
- The Indian economy does not recover and continues its poor show for the next 5 years.
In such a scenario, CARE Ratings will not show an improvement in business performance, but the likelihood of losing money (stock price decline) from today’s low valuations seems unlikely. - If there is another financial crisis like the one that happened in 2009, there will be a severe decline in the prices/valuations and a further decline in PE ratios. However, in the last financial crisis, revenue from credit rating services did not reduce for CRSIL and ICRA.
- CARE Rating has higher margins than CRISIL and ICRA. The reason is that CARE pays lesser average salaries to its employees than the industry. This has traditionally been CARE Ratings’ strategy. We are assuming that it will more or less be able to continue with this strategy in the future as well and this there will not be much of a margin contraction in 2024
- India enters an age of stagflation where growth is slow/moderate and inflation is high. This phase is very bad for the economy. It may take years to come out of this phase.
To sum it up, macro-economic problems are the biggest risk to the entire investment thesis. However, these worries are not currently reflected in the valuations of CRISIL and ICRA. The market expects the other two credit rating agencies to do well
Disclaimer: Please do not consider this article as a stock recommendation. The article is an illustration of the kind of analysis that goes into fundamental research and equity investing.
Please consult your investment advisor before making any investment decisions.
The author (@amey153) is a SEBI registered Investment Advisor.
If you want to seek investment advice click here and someone from my team will get in touch with you within 48 hours.